


The first thing that you tend to learn when you start with Data Science in Python is the pandas module, which covers literally any kind of data manipulation, transformation and processing for tabular datasets. As a module, it has developed itself insanely over the years to the utility that it is today for a data scientist.
Having said that, we haven't had many contenders for Pandas for quite some time at least in the general space. We do have tools with specific use cases, like Spark for Big Data, for example.
With the increase in data volume, people have been hamstrung by the processing time delays with Pandas. Here's where Polars comes in.
What is Polars?

Polars, on its website calls itself a "Lightning-fast DataFrame library for Rust and Python". Given the amount of popularity Rust had gained recently, I started noticing a lot more references to Polars lately. Without getting too technical, I'll sum up Polars by saying that it's super fast because it's written in Rust, supports lazy evaluation and can leverage multithreading capabilities of a system if available.
There is enough evidence out there proving how much faster it as compared to Pandas, but in this article, let's just try to explore Polars as just another DataFrame library in Python.
Hop In to Jupyter
It's time to warm your hands, grab that cup of coffee and open up your favourite Jupyter environment. I've setup a Jupyter server on Napptive to play around.
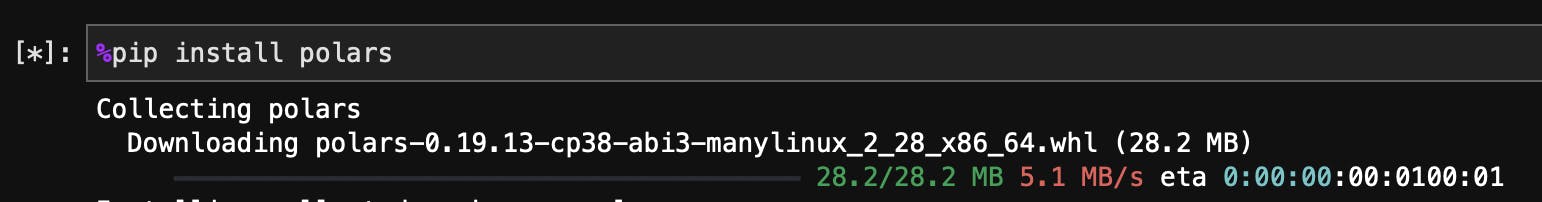
We can start by installing the polars library in our environment.
Loading the Dataset
We'll start by loading a simple car-sales dataset.
import polars as pl
df = pl.read_csv("car-sales.csv")
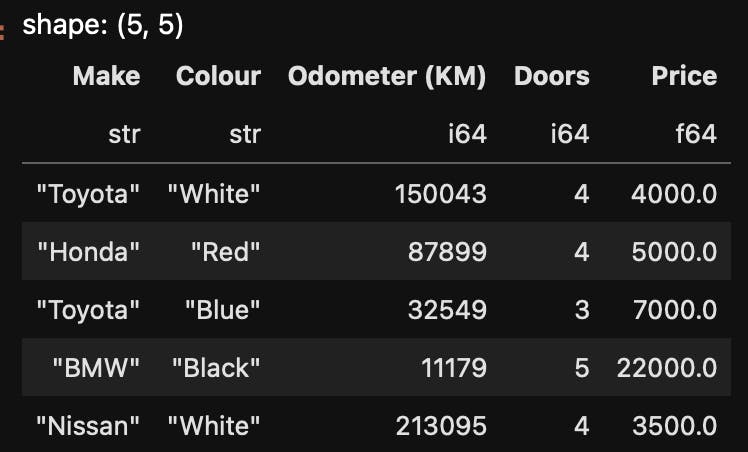
df.head()
Very similar to what we do in pandas, we use the read_csv method; and we see the first five rows printed out when we use df.head()

Next up, if we want a quick statistical summary of the dataset, we can use df.describe() to take a look.

This is obviously only useful for numerical columns.
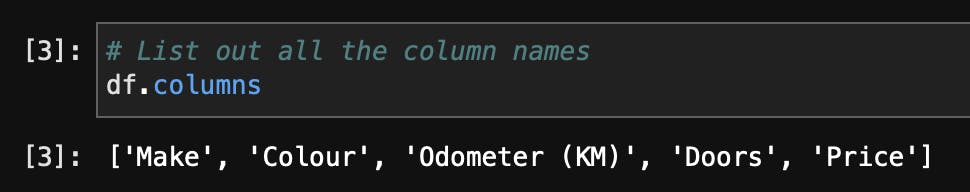
This has been almost identical to pandas so far, but if I want to take a look at all the columns in the dataset, we use df.columns
Data Manipulation and Filtering
Now that we're a little comfortable, we can start getting our hands a little dirty and start working on a few operations and filters with the dataset.
# For starters, let's apply a filter to our dataset.
# I want to separately take a look at all Honda cars in our dataset.
# How would we do that?

honda_cars= df.filter(pl.col("Make") == 'Honda' )
honda_cars.head()

Now let's say I'm a little low on budget, I want to take a look at cars that cost 5000$ or less. But for this, I'll have to change that price column a bit, because it's currently a string.
Let's first transform the Price column to a float value. We'll need to take out the $ sign and the commas.
# Remove the dollar sign and the comma from the Price column
df = df.with_columns(
    pl.col("Price").str.replace("\$", "").str.replace(",", "").cast(pl.Float64),
)
df.head()
Now that we have the Prices sorted out, we can apply a filter to show only cost 5000$ or less.
Let's apply this filter.
# Just like we did for Honda, let's apply another filter,
# this time to see only those cars priced 5000$ or less

budget_cars = df.filter(pl.col("Price") <= 5000.0)
budget_cars
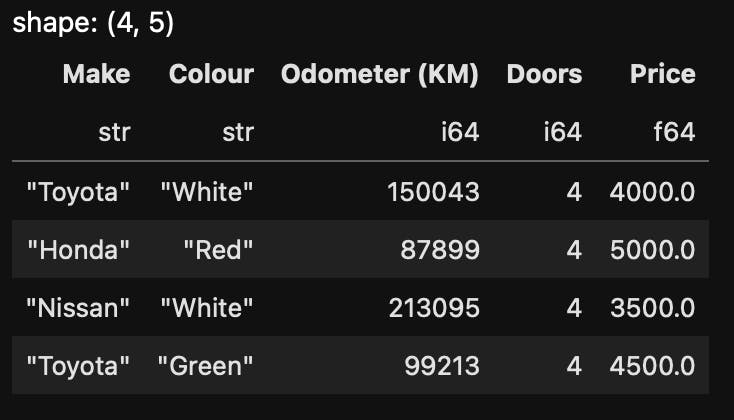
And we get exactly what we wanted.
Now let's pretend like I'm a car geek and I'm very curious about those Odometer values across car manufacturers. I'd want to take a look at the average Odometer values and their average prices across car manufacturing brands.
# Here's where things get a little different from pandas
# Let's write a query to group this data by the car's make,
# and see their average Odometer values and price.
q = (
    df.lazy()
    .group_by("Make")
    .agg(
        pl.mean("Odometer (KM)").alias("Average Odometer Reading"),
        pl.mean("Price").alias("Average Price")
    )
    )
q.collect()
Now we see a lot of things going here. The first thing we do is call the lazy function; to trigger lazy evaluations for the query, as we discussed as one of the very popular features of Polars.
We're grouping the table by the Make column; and then we use the agg function where we can say that we want the mean of both Odometer and Price columns.
We then use alias to give those a different column name.

And look at that! We've got our result :)
This was a very brief introduction to the Polars module. While I don't believe it's a direct replacement for Pandas yet (long way to go), it has a huge amount of potential and much like any other open source software, it's ever growing. We'll keep exploring this module as I plan to make this a series of threads for Polars.
Stay tuned for more, until then, peace.